

5K Race: Another View of the Data
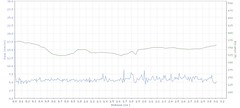
While my Garmin Forerunner 205 calculated the race distance at 3.10 miles, both SportTracks and MotionBased crunched the GPS waypoints in their respective complex algorithms and spit out 3.11 miles.
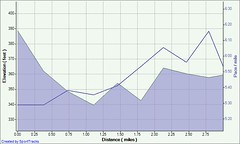
However, MotionBased also has the MB Gravity Elevation Correction feature, which smooths the elevation data taken from the GPS device. It came up with the following elevation information for the 5K course (with the 205's data in parentheses):
| Start Elevation (ft): | 368 (387) |
| Finish Elevation (ft): | 360 (358.5) |
| Min. Elevation (ft): | 322 (338) |
| Max. Elevation (ft): | 371 (387) |
Technorati Tags: Garmin, GPS, Global Positioning System, Satellite Navigation, Forerunner, MotionBased, SportTracks
posted by John @ 7:28 PM
![]()
![]()
<< Home